Data Science & Analytics using R
Description
Foxmula’s Data Science and Analytics using R course is highly beneficial at different career stages. Hence, it is recommended for students, professionals and managers as well. The best thing about this online course is that you get to learn both analytics as well as visualization in one single course.
The course has been specially designed to help you understand one of the most critical tools of data science – R Statistical Environment. This course primarily focusses upon helping the individuals distinguish between R and R programming language into concepts that are simple and easy to understand. The course curriculum covers everything that you will be required to learn to get started with Data Science and Analytics.
Course Content
The course will cover the topics such as Basis & Advanced Data Visualization, Maps Generation by making use of JSON Structures, Statistics Implementation, Data Manipulation as well as Data Munging/Wrangling and so much more.
Prior to completion of the course, you will be able to master exactly how to work utilize and work with data and manipulate it according to needs. So, anyone who is looking to take greater strides into the world of Data Science, for them it is the perfect course.
You will learn the following during the course-
- Implement concepts of Data science using R
- Execute statistical models through R
- Learn core concepts of R programming
- Learn to visualize data using R
- Develop a functional understanding into business analytics
- In-depth understanding of data structure utilized in R
- Learn the skill of importing/exporting data in R
- Learn the use of various graphics in R for the purpose of data visualization
-
Training
1 month Training, 1 Year access, Industry-Oriented, Self-Paced.
-
Certification
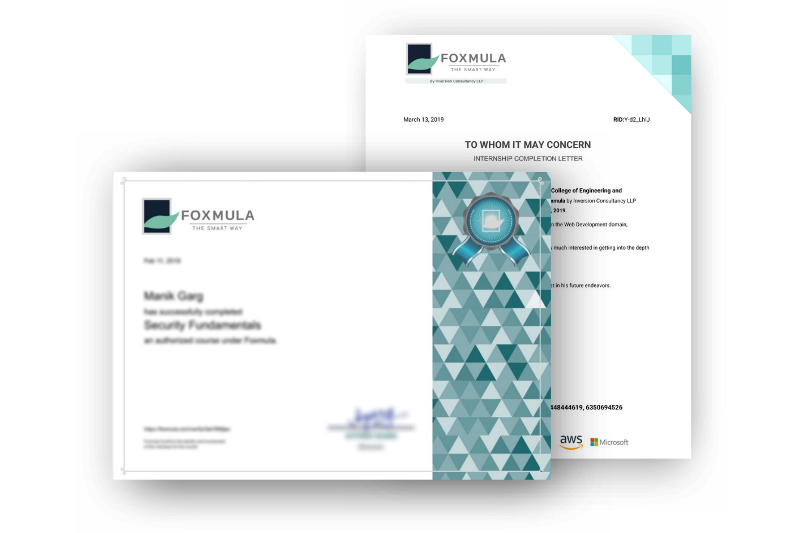
Small & basic Objective MCQ type online exams & Foxmula Certification.
-
Internship
45 days Internship Completion letter post project submission on our GitLab. Projects are Industrial, Small and based on your training.
-
1 year of Live Sessions by Experts
Be a part of interactive webinars every weekend, by experts on cutting edge topics.

How It Works
Curriculum
- Data Frame
- Variables
- Reading Data
- Functions
- Histograms
- Generating Random Numbers
- Density and Cumulative Distributive Functions
- Comparing Distributions
- Linear Regression
- Generalized Linear Models
- Polynomial Regression
- Non-Linear Regression
- Introduction to Tree based Models
- Tree Error Rates
- Random Forests
- Introduction to Apache Kafka
- Using RapidMiner
- Hadoop for Big Data


